Greece Hotel Season 2025 vs 2024: What the Numbers Actually Show
How are Greek hotels performing in 2025 compared to 2024? ADR, RevPAR, occupancy, and cancellations in a year-over-year comparison. What the data shows and what it means for your strategy.
Want to see your own numbers? Upload a file and follow along.
Greece Hotel Season 2025 vs 2024: What the Numbers Actually Show
Greece remains one of the most dynamic tourism markets in Europe. But what happens at the level of an individual property?
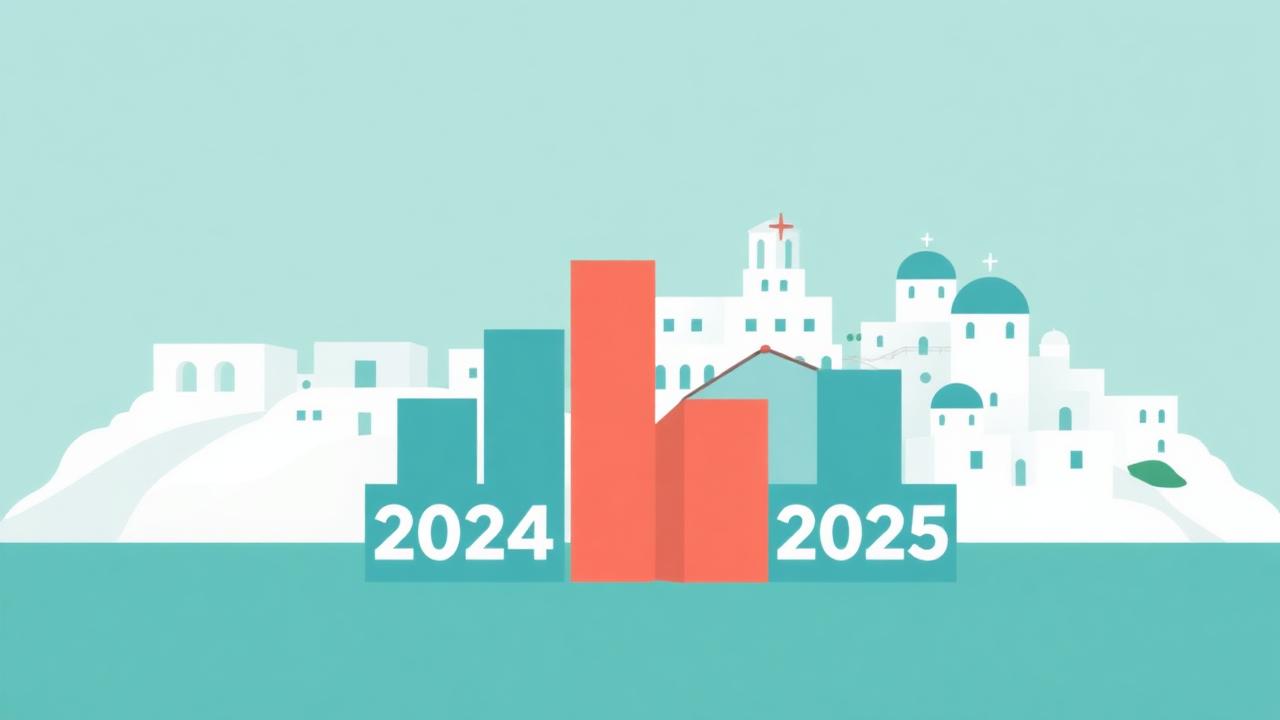
Greek Tourism in Numbers: 2024 and 2025
The 2024 season was exceptional. International arrivals exceeded 35 million, and tourism revenues reached historic highs. In Athens, hotel ADR settled around €172, with RevPAR at approximately €133.
The 2025 season continues on an upward trajectory with more measured growth rates. Hotels in popular destinations - Santorini, Mykonos, Crete, Rhodes - are generally seeing stable demand, while boutique properties in less established locations face greater competitive pressure from new supply.
What "A Good Year" Actually Means for an Individual Hotel
The market can be performing well while a specific hotel performs worse than the previous year. The comparison that matters is always your own performance year-over-year.
Three questions every hotelier should answer about 2025: Did your ADR increase or decrease compared to 2024? Did your occupancy track the market trend? Did your cancellation rate increase?
Trends Appearing in Boutique Hotel Data for 2025
Season extension: May and September/October are showing booking growth, primarily from Germany, the United States, and the UK seeking less crowded experiences.
Earlier lead times: Bookings for peak season are being made progressively earlier.
ADR pressure: Increased supply from new hotels is creating competitive pressure.
Cancellation rate growth: The continued spread of free cancellation rate types across OTAs keeps pushing aggregate cancellation rates higher.
How to Run Your Own 2025 vs 2024 Comparison
RevBuddy processes your booking files automatically and shows grouped monthly bar charts for ADR, Revenue, Occupancy, and Cancellations, a monthly comparison table, channel mix shift, and automatically generated insights.
Conclusion: The Headline Numbers Do Not Always Apply to Your Property
Try it for free at rev-buddy.com - upload your files and see the 2025 vs 2024 comparison in a few minutes.
See your own data live
Upload your booking export and see ADR, RevPAR, occupancy and STLY in minutes. Free.